Housing Prices
The last few years of the housing market have been absolute insanity, but are we paying more for houses now than we did before? Have rental prices become more affordable? In this article, we will jump into the data and find out just how affordable of a market we’re currently in (Q2 2023).
The video blow covers all of this information, so if you prefer watching/listening, you can skip the bulk of this article.
After the onset of the covid-19 pandemic, the Federal Reserve jumped into action to help avoid a catastrophic housing crisis, lowering interest rates (which subsequently squashed mortgage rates) and help spur buying. The result was the lowest mortgage rates of all time, and quite possibly, the most aggressive housing market in recent history.
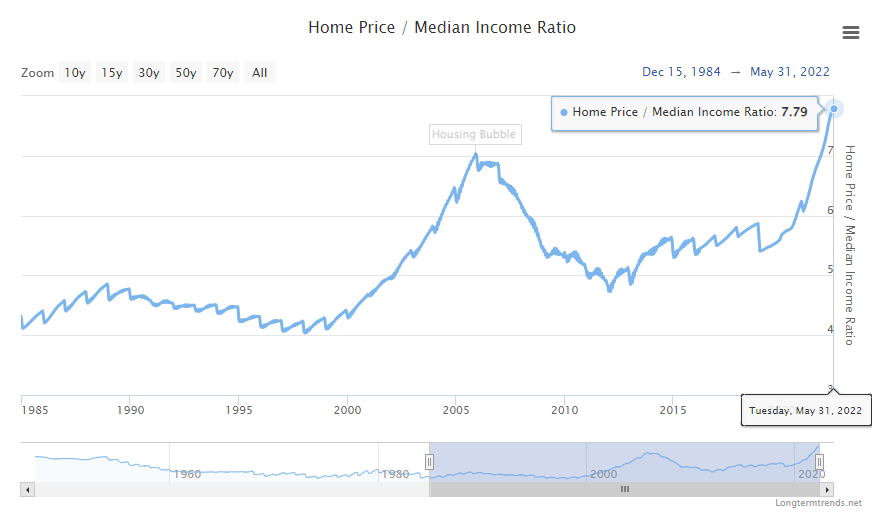
Fast forward to early 2022, housing prices were at the highest (vs income) that we have seen in the past 40 years. This point is even higher than where we sat preceding the Great Recession. Important to note, don’t let this bit of information lead you to the belief that the market is going to crash as it did in 2008/2009, the market fundamentals are much different here.
Something else was happening concurrently, the Fed, was rapidly increasing interest rates to deal with incredible levels of inflation. The rising rates translated into higher mortgage rates as the cost to lend money became more expensive.
Prices have softened a bit (though I’m uncertain what income levels have been doing since this date to influence the ratio), but as we are moving into the spring market, I am seeing much more buyer activity which will undoubtedly put upward pressure on prices.
Before moving further, let’s look at the largest factors contributing to the prices we see above:
- Incredibly low interest rates increased buying power and led to more competition
- Unmet demand for housing supply due to significant drop-off in new home construction
We already discussed interest rates, but let’s go a little deeper into the second factor of the housing prices that we are seeing.
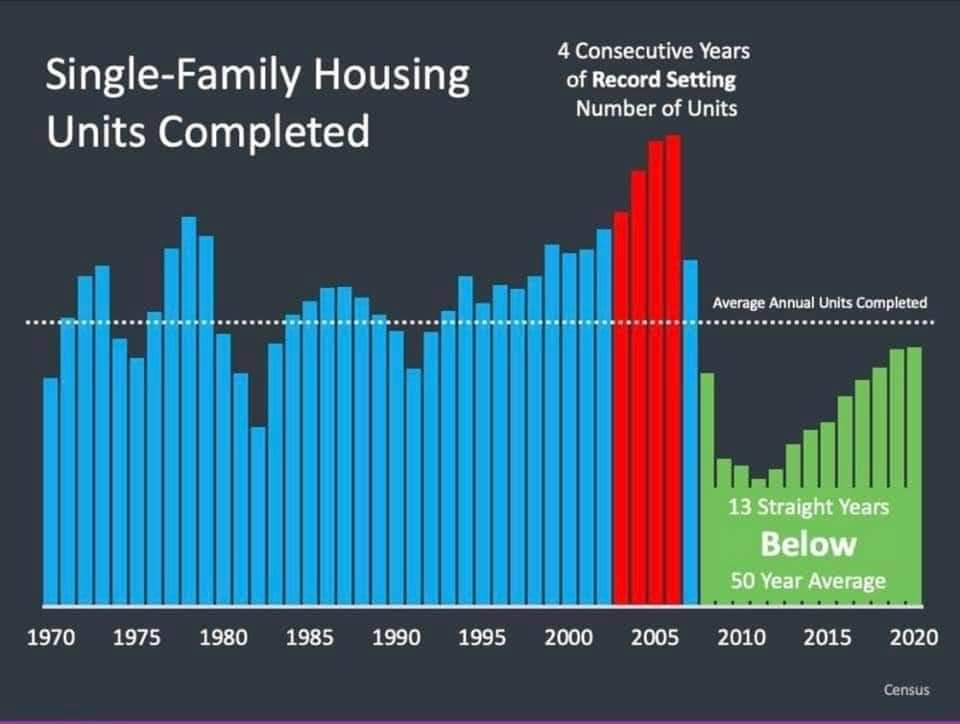
Going into the Great Recession, demand for housing plummeted, and it became far less lucrative for developers to be putting new houses on the market. As a result, we saw average units built per year drop to near half, and we were only slowing building up to sustainable levels.
In 2020, with so little newer construction housing coming to the market, or in development, the supply of housing was far outpaced by demand. Fewer houses on the market, meant that more people were competing for these houses, while simultaneously being incentivized with those incredibly low rates. Both factors together brought on a perfect storm of excessive buyer demand, and abysmally low housing supply.
The effects of such low building rates are going to continue into the future, creating more upward pricing pressures. This is a difficult dial to manipulate as houses are costly to build and often face bureaucratic hurdles.
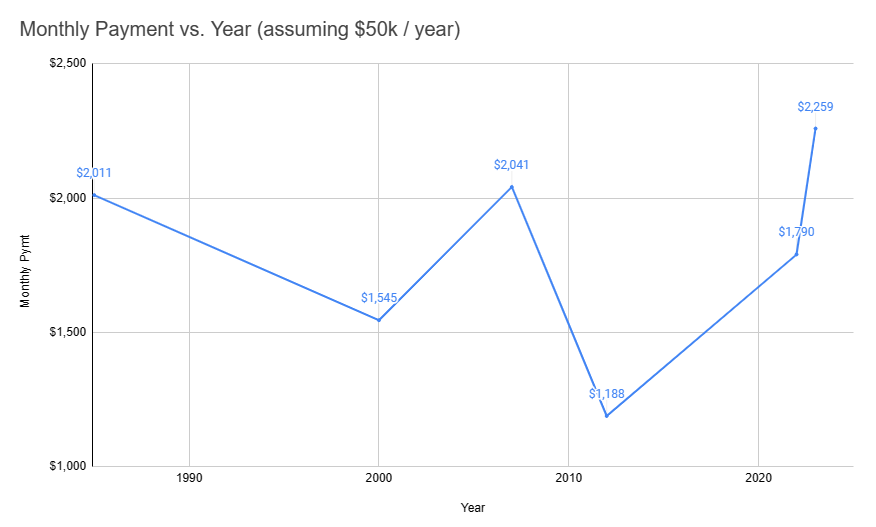
I made the monthly payment chart myself, and it is in response to a very disingenuous (or ignorant) statement I often hear from my fellow real estate agents: Interest rates are still historically low
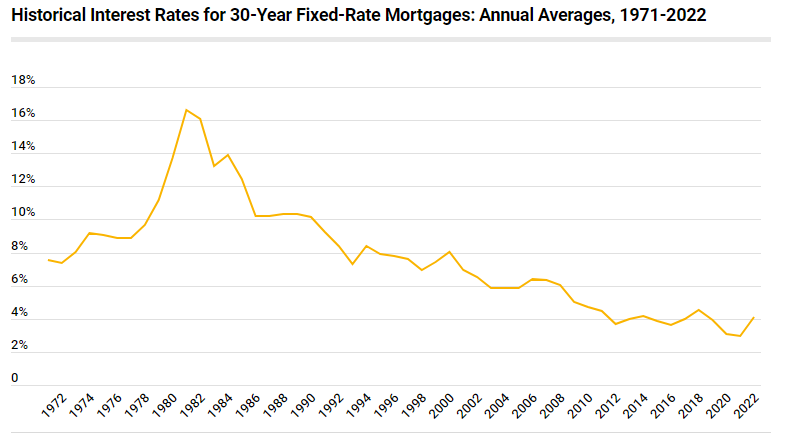
This first chart, you can see that mortgage rates have indeed been quite high, eclipsing 16% in the late 1970s. The average over time is just around 8%. So, going by that, these individuals are in fact correct that rates are lower (right now we’re seeing around mid-6%).
Coming out of a period with such low rates, naturally people are going to feel that they missed out on such an incredible opportunity. To placate these feelings, many in my industry will offer the statement above without considering all the factors.
In this chart above, I highlighted a few periods in time with significant fluctuations in prices, incomes and rates. Rates will often be contrasted with the late 70s/80s to show just how low rates are today, even after the big jump.
However, what they’re neglecting to mention, is that at the same time, housing prices have accelerated at a far higher rate than any other point in US housing history. So above, the first data point I use is at a 12% rate, but relative to income, housing prices were not too significant. By 2000, rates had fallen to almost half, while the price to income ratio remained stable. Before the great recession, prices were much higher, with rates remaining similar, preceded by a big drop in prices.
Where we really want to pay attention is the past few years. Remember in the first chart, housing prices have gone up to the highest levels in the past 40 years relative to income, but at the same time, the mortgage rate was at the lowest level. This amounted to a house cost less than that of houses in the 80s with a 12% rate.
Going into 2022, rates continued to rise, and housing prices didn’t see any drop-off, leading to housing costs even more expensive than those during the highest mortgage rate days.
So yes, housing costs are at the least affordable (slightly less so now) than at any point in the past 40 years.
Is Renting More Affordable?
Now that we’ve seen where housing prices stand, let’s move over to rent prices.
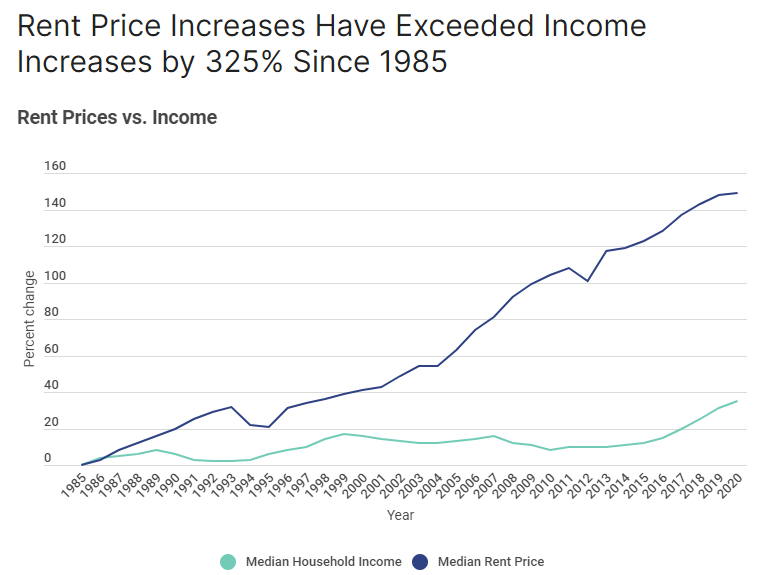
A little different from the charts above, this is not a ratio, but rather a side-by-side comparison of rental price and income increases. Very simple, rental prices have far outpaced those of income gains.
From 2020 to 2022, we saw staggering increases in rental prices. More than a dozen states across the country saw year-over-year increases of over 20%, with Florida being at the top with an incredible 29%.
Oregon saw much less rental price growth, being 38th overall (11%). This largely in part due to the recent passing of SB 608 which capped rental increases to:
7% + CPI (Consumer Price Index) = Rental Price Cap
This year the increase was 14.6% with excess inflation.
The final chart I will show you is a bit grim, if you’re uncertain why, you will find out shortly.
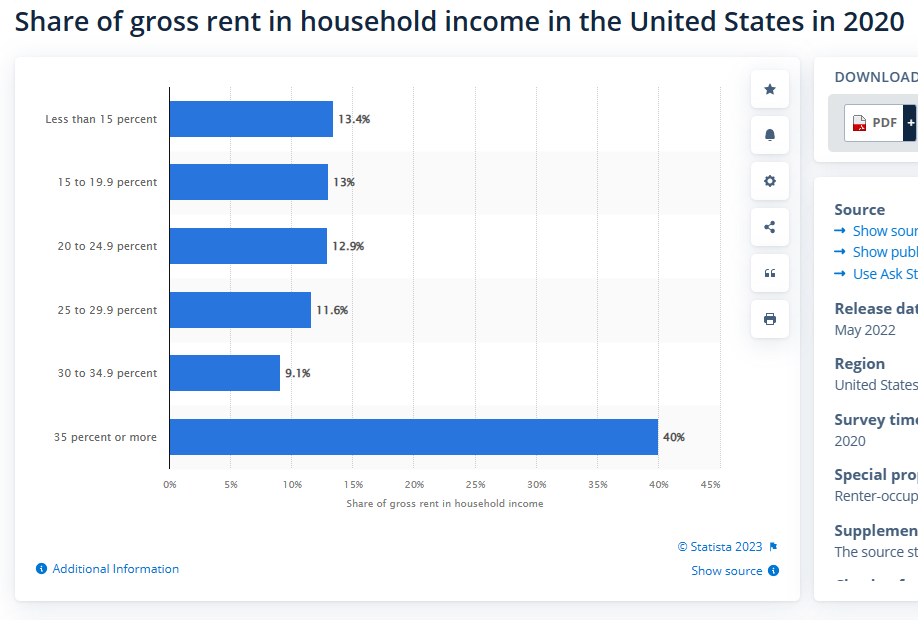
With the increases in rental prices, this chart is a bit data, we can expect it to be somewhat worse than depicted. Nevertheless, nationwide what we see is that almost 50% of renters are contributing at least 30% of their income to rent. Leaving only 70% to go to all other expenses.
Good luck saving any substantial downpayment in the meantime.
A recent study conducted by Zillow found that cities in which rent to income exceeded 32%, there were significantly higher levels of homelessness, as would be renters struggle to make ends meet while holding a roof over their heads. And it should be of no surprise that Americans personal debt is sharply on the rise as they struggle to keep heads above water.
My 2023 / 2024 Prediction
Take this with a grain of salt, any sudden movement in the market can propel us in one direction or another.
In terms of housing prices, I see those continuing to rise in most markets. A few which experienced sensational growth might see some retraction, but I believe this will be the exception to the norm.
Rental prices I see a similar pattern. They have grown consistently year-over-year, regardless of income gains, and I wouldn’t expect this trend to continue.
Mortgage rates are a tough one. As the market stands right now, they will remain stagnant. However, cracks in the economy such as poor job reports, stagnant incomes, more widespread banking woes, or good news such as declining inflation, would cause the Fed to loosen their stranglehold on interest rates and subsequently drop mortgage rates.
But the relation of rates to housing prices is a difficult one, will housing prices accelerate at a slower pace allowing more drops in rates to bring more Americans into affordability? Time will tell.
With affordability currently out the window, rates and prices being stubbornly high, there is another dial that can be turned to help reign in the problem.
Enter 40-year mortgages.
I have considered this as a solution the powers to be would offer, and it appears this might be in the works and available to consumers in the near future as this is becoming available as a loan modification (currently unavailable for purchasing).
Is it the best solution? I’m not so sure, that is a discussion for another day, but it could become a solution, nonetheless.


Buy

My Listings

Sell

